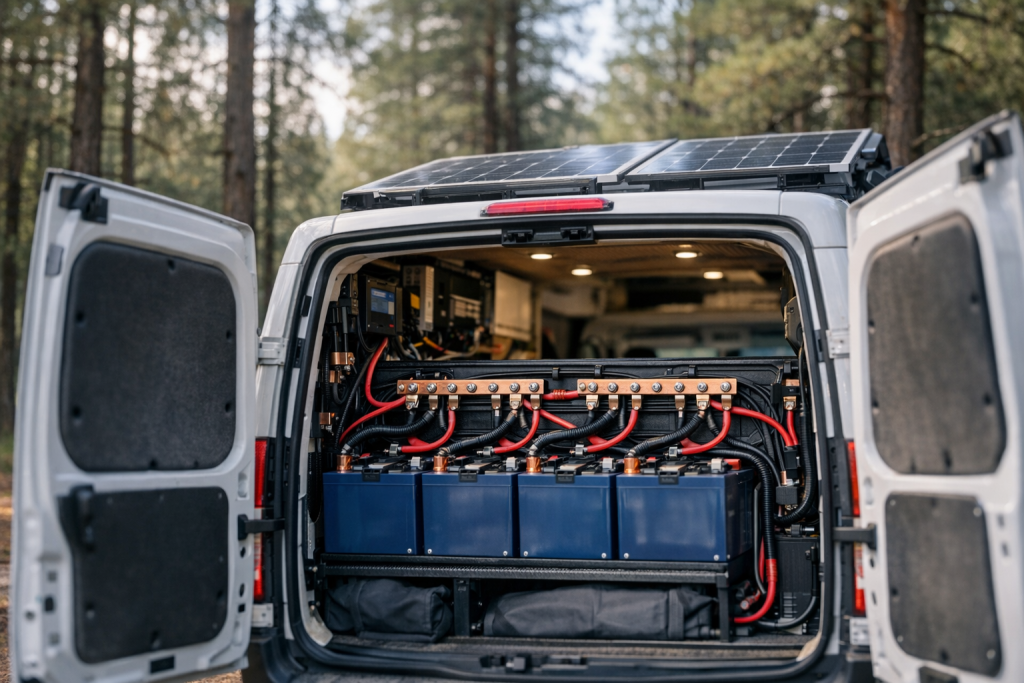

Every RV solar array is a compromise between three hard limits: the unshaded square footage on your roof, the weight your roof structure can carry, and the sunlight your travel region delivers in its worst month. You cannot size an array by copying someone else’s build, because their daily energy consumption, their latitude, and their wiring losses are not yours. The only sizing method that survives contact with reality is one built from your own measured numbers — and that is the method this guide teaches.
Accept one uncomfortable truth before touching a spec sheet: an array sized for a July trip in the desert Southwest can fall dramatically short during a November stay in the Pacific Northwest. If you camp year-round, you size for the worst-case month or you plan an explicit backup charging strategy. There is no third option that doesn’t end with dead batteries.
TL;DR
- Know your daily Wh: Sum all loads to find total daily energy consumption.
- Divide by PSH × efficiency: Use your location’s peak sun hours and a system efficiency factor based on your actual installation losses.
- Size for worst month: Use the lowest PSH value in your travel range, not the annual average.
Solar Sizing by Use Case
Use the worksheet below to size an array for your own profile. Describe your use case — days off-grid at a stretch, season, region — then fill in the three numbers the sizing formula needs: your measured daily watt-hour consumption, your location’s actual peak sun hours, and your installation-specific efficiency estimate. Resist borrowing numbers from forum posts or “typical RVer” charts: two rigs with identical floor plans can differ several-fold in daily consumption depending on refrigeration type, climate-control habits, and inverter use.
To get your daily watt-hour figure, run an energy audit on your own equipment. For each device you plan to run off-grid, find its power draw from the manufacturer’s nameplate or datasheet, or — far better — measure it directly: a DC clamp meter on the supply wire, a shunt-based battery monitor logging a representative day, or a plug-in watt meter for inverter loads. Multiply each device’s measured watts by the hours per day you actually use it, sum the results, and add a margin for phantom loads and things you forgot. A shunt-based monitor watching your battery bank over two or three normal days is the gold standard, because it captures everything, including losses you didn’t itemize.
| Your Profile | Your Measured Daily Wh (from your energy audit) | Your Location’s PSH (looked up) | Your System Efficiency Estimate | Required Watts (calculated from formula) |
|---|---|---|---|---|
| (your profile — describe it) | (your value) | (your value) | (your estimate) | (calculated) |
| (your profile — worst-case month) | (your value) | (your value) | (your estimate) | (calculated) |
| (your profile — alternate region or season) | (your value) | (your value) | (your estimate) | (calculated) |
Fill in one row per scenario you genuinely expect to live. If you snowbird between two regions, run a row for each. If your consumption changes seasonally — more fan or heater runtime, longer lighting hours — audit each season separately rather than averaging them into a number that is wrong for both.
Short version: the worksheet is only as good as the audit behind it. Measure, don’t guess.
System Losses and Derating Factors
Panel nameplate wattage is a laboratory number, measured at standardized test conditions your roof will rarely see. Between the panel glass and your battery terminals, several loss mechanisms each take a bite; together they are why real-world harvest always lands below the nameplate math. Estimate each factor for your specific installation rather than adopting someone else’s blanket percentage.
Temperature. Photovoltaic panels lose voltage — and therefore power — as they heat up. Every panel datasheet lists a temperature coefficient of power, expressed as a percentage loss per degree above the test temperature. Roof-mounted RV panels with little airflow underneath run hot in summer sun, so your panels can be least efficient on the brightest, hottest days. Flexible panels glued flat to the roof run hotter than rigid panels on standoffs with an air gap, and degrade faster for the same reason. Read your panel’s coefficient and factor in your mounting method.
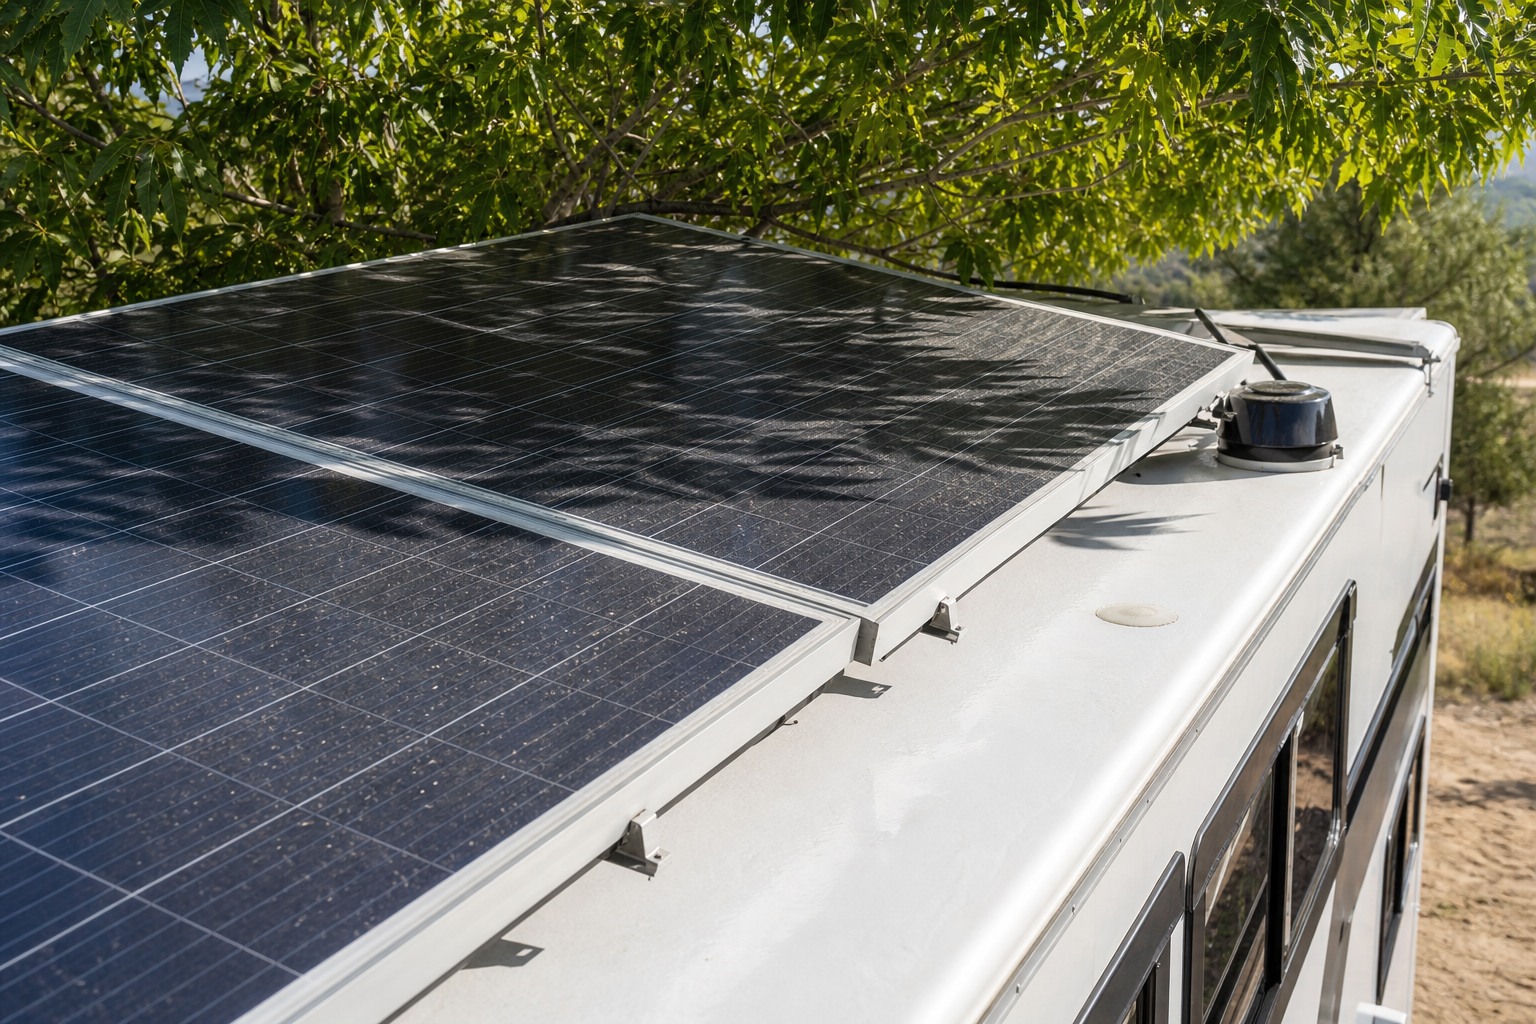
Wiring. Every foot of cable between panels, controller, and battery has resistance, and resistive loss grows with the square of current. Undersized wire on a low-voltage array can quietly eat a surprising share of your harvest. Use a voltage-drop calculator with your actual wire gauge (AWG), run length, and operating current, and size conductors so the drop stays small. Higher array voltage (panels in series) reduces current for the same power and shrinks wiring losses — one reason series wiring is popular with MPPT controllers.
Charge controller. No controller is lossless. MPPT controllers convert excess panel voltage into additional charging current and typically extract meaningfully more energy from the same array than PWM controllers, which clamp the panel to battery voltage and discard the difference. Even a good MPPT controller has a conversion efficiency below one hundred percent — check the manufacturer’s efficiency curve at your expected operating point. If you pair a PWM controller with panels whose maximum-power voltage sits well above your battery voltage, expect a substantially larger effective loss.
Shading and soiling. Partial shade is disproportionately destructive: shading a small fraction of a panel can collapse the output of an entire series string, because the shaded cells throttle current for every panel wired in series with them. Rooftop air conditioners, vent fans, antennas, and tree canopy all cast moving shadows across the day, and dust, pollen, and road film skim off output until you clean the panels. If your roof layout guarantees some shading, wire panels in parallel or in small independent strings, and budget a larger shading loss.
Orientation and incidence angle. Flat-mounted panels are never pointed directly at the sun except near solar noon in summer at lower latitudes. In winter, with the sun low on the horizon, the incidence-angle penalty on a flat panel is severe. Tiltable mounts or portable ground-deploy panels recover much of this loss but cost setup time and stowage space.
To build your personal efficiency estimate: start from the controller’s stated efficiency, multiply by your calculated wiring efficiency, apply a temperature derate appropriate to your mounting style and climate, then apply an honest shading-and-soiling factor for your roof layout. The product of those factors is the “system efficiency” term in the sizing formula. Two disciplined installers can legitimately arrive at different numbers — a rigid-panel installation with heavy-gauge short cable runs and an unobstructed roof deserves a more optimistic factor than a flexible-panel install glued around a rooftop AC unit at the end of a long thin wire run. After installation, validate the estimate against measured harvest and revise it.
Worked Examples
Both examples below use assumed inputs chosen to demonstrate the arithmetic. Substitute your own audit, PSH lookup, and efficiency estimate before drawing conclusions.
Example 1: Summer Weekender in Arizona (illustrative — assumed values, not a default profile)
Worked example — assumed values for illustration only. Suppose a shunt-monitor energy audit came back with a measured consumption of 1,500 Wh per day for summer trips. Suppose the looked-up June PSH for the camping area, modeled for flat-mounted panels, is 6.5 hours. Suppose the installer worked through their loss factors — a quality MPPT controller, short heavy-gauge cable runs, rigid panels on standoffs with airflow but significant heat derating in desert sun, and a clean unshaded roof — and settled on a system efficiency estimate of 0.75.
- Denominator first: 6.5 PSH × 0.75 efficiency = 4.875 effective full-power hours per day.
- Required watts: 1,500 Wh ÷ 4.875 h = approximately 308 W of array nameplate.
- Add recovery headroom: rounding up to the next practical panel configuration — say a nominal array around 400 W — provides margin to refill the bank after a cloudy day and absorbs consumption creep.
Example 2: Year-Round Full-Timer in the Pacific NW (illustrative — assumed values, not a default profile)
Worked example — assumed values for illustration only. Now suppose a different reader’s audit measured 2,400 Wh per day of winter consumption — winter audits often run higher than summer ones because of heater fans, longer lighting hours, and more time inside on powered devices, which is exactly why each season deserves its own audit. Suppose the looked-up December PSH for their coastal Pacific Northwest location, flat-mounted, is a bleak 1.5 hours. Suppose their efficiency estimate, after accounting for low winter sun striking flat panels at a steep angle, frequent soiling from rain-borne grime, and a rooftop vent shading part of the array in the afternoon, is 0.70.
- Denominator: 1.5 PSH × 0.70 = 1.05 effective full-power hours per day.
- Required watts: 2,400 Wh ÷ 1.05 h ≈ 2,286 W of array nameplate.
That result is not a mistake — it is the honest arithmetic of dark winters, and most RV roofs cannot physically carry an array that size. The realistic responses: reduce winter consumption, add tiltable or ground-deployed panels to claw back the incidence-angle loss, accept a planned solar deficit covered by a generator or DC-to-DC charging while driving, or winter somewhere sunnier.
The contrast between the two examples is the entire lesson of solar sizing: the same formula, applied to different measured loads and different regional sun, produces answers nearly an order of magnitude apart. Anyone quoting a single “right” array size for RVs is answering a question they haven’t asked you.
Matching Panels to Battery and Controller
An array is one leg of a three-legged system. Panels, controller, and battery bank must be balanced, or the weakest component throttles or endangers the others.
Controller voltage limit. Every charge controller has a maximum input voltage. Your array’s total open-circuit voltage (Voc) — summed across all panels in a series string — must stay below that limit under all conditions. Panel voltage rises as temperature falls, so run the check at the coldest temperature your rig will ever see at sunrise, using the panel’s temperature coefficient of Voc from the datasheet. A string that is comfortably legal on a summer afternoon can exceed the controller’s ceiling on a frigid clear morning and destroy it.
Controller current rating. The controller’s rated output current at your battery voltage sets the ceiling on usable array wattage. Many MPPT controllers tolerate a modestly oversized array — they clip the excess at the current limit — and some installers deliberately overpanel to fatten harvest in weak light. Check the manufacturer’s stated maximum array wattage, and never exceed the input voltage limit, clipping or not.
Battery bank capacity. The bank must store at least one full day’s consumption plus your desired days of autonomy — the cloudy days you want to survive without meaningful harvest. Battery capacity is never one hundred percent usable: usable energy is nameplate capacity multiplied by the depth of discharge (DoD) the manufacturer recommends for the cycle life you want. Lead-acid chemistries typically tolerate far shallower cycling than lithium iron phosphate before cycle life suffers; check the specific manufacturer’s DoD guidance for your model rather than assuming a chemistry-wide figure. Charging is also not lossless — some fraction of the energy your array sends into the bank is dissipated in charge inefficiency, and lead-acid absorbs charge slowly in its final stage, which matters when winter sun gives you only a short harvest window.
Charge rate matching. Batteries have manufacturer-recommended maximum charge currents. A very large array feeding a small bank can exceed that limit; a very large bank fed by a small array may rarely reach full charge, which is especially harmful to lead-acid chemistry that needs regular full absorption charges. Check your battery datasheet’s recommended charge current range and confirm your array’s realistic peak output lands inside it.
Series versus parallel. Series strings raise voltage, cut wiring losses, and help MPPT controllers wake up earlier in weak light — but they are more vulnerable to partial shading. Parallel wiring is shade-tolerant but demands heavier cable and string fusing. Many RV roofs, with their scattered obstructions, end up best served by two or more short series strings in parallel. Choose the topology from your actual roof shading map, not habit.
Realistic Expectations
Sized correctly for your worst month, your system will feel almost boringly abundant in summer: batteries full by early afternoon, controller idling in float. That surplus is not waste — it is the same array meeting a much harder winter target, and it is your buffer against cloudy stretches during the good season.
Winter is a different machine. Expect short days, low sun angle on flat panels, cloud cover, and cold-weather consumption to compress harvest severely — in northern regions, the worst month can deliver a small fraction of the best month’s energy. Plan for multi-day cloudy runs where the array contributes little. Your battery bank’s autonomy days carry you through the first stretch; after that you need a fallback: a generator, shore power, or DC-to-DC charging from the vehicle alternator while driving. A deliberate hybrid strategy — solar for the sunny majority, backup for the dark tail — is often cheaper, lighter, and more reliable than a roof-crushing array sized to survive the single darkest week of the year on solar alone.
Callout: if monitoring shows the bank routinely failing to reach full charge in your worst month, treat it as a data point, not a disappointment — revise your efficiency estimate, adjust consumption, or invoke the backup plan before chronic undercharging damages the batteries.
Safety and Common Mistakes
- Fuse or breaker every parallel string and the controller-to-battery run. Parallel strings can backfeed a faulted panel with the combined current of its siblings; string fuses sized per the panel’s maximum series fuse rating prevent that. The conductor between controller and battery must be protected at the battery end, sized to the wire’s ampacity.
- Never exceed the controller’s maximum input voltage — checked at cold temperature. Compute the array’s series Voc at your coldest realistic morning using the panel’s temperature coefficient of Voc. Overvoltage failures are typically instant and unwarrantied.
- Respect roof structure and weight limits. Rigid panels, rails, and hardware add real mass concentrated on a membrane roof. Verify the manufacturer’s roof load guidance, mount into structural members where possible, and seal every penetration with roof-appropriate sealant to prevent the slow leak that ruins the rig.
- Disconnect means matter. Install a switch or breaker to isolate the array from the controller and the controller from the battery, so you can service either safely. Connect the controller to the battery before connecting panels, per most manufacturers’ instructions.
- Don’t trust the plan — verify it. Install a shunt-based battery monitor and compare actual daily harvest against your worksheet prediction across a few weeks. Real data will expose an optimistic efficiency estimate or a shading problem long before a dead bank does.
- Avoid mixing mismatched panels in a series string. Series current is limited by the weakest panel; mixing dissimilar panels in one string wastes the stronger ones. If you must combine different panels, put them on separate strings or separate controllers.
FAQs
- Is 400 W of solar enough for a camper? There is no universal answer — it depends entirely on your measured daily Wh, your region’s peak sun hours in the months you camp, and your installation’s efficiency. Run the formula with your own audit numbers; for some rigs 400 W is generous surplus, for others a chronic deficit.
- What is the solar 120% rule? It is a residential electrical-code provision limiting how much backfed solar breaker capacity can share a grid-tied panelboard with the main breaker relative to the busbar rating. It applies to grid-tied home installations, not off-grid RV systems — RV arrays are governed instead by controller ratings, wire ampacity, and proper fusing.
- Will a 100 W panel run a 12 V fridge? Only your fridge’s datasheet or a measured audit can answer that. Log the fridge’s actual daily Wh over a representative day (ambient temperature matters a great deal), then divide by your location’s PSH times your efficiency estimate — remembering the fridge runs at night on battery, so the panel must replace a full day’s consumption during daylight hours.
- How long will an array take to recharge my battery bank? Estimate it as the energy deficit in Wh divided by (array watts × system efficiency), spread across your daily PSH — then add margin, because charge acceptance tapers near full, especially for lead-acid chemistries. Deep deficits in low-sun months can take multiple days to recover, which is exactly why headroom above break-even sizing matters.
- Can I add more panels later? Yes, if your controller has headroom on both maximum input wattage and maximum input voltage (checked at cold-temperature Voc for the expanded string layout), and if your roof has the space and structural capacity. Plan wire gauge for the future array size during the first install to avoid recabling later.
- Rigid or flexible panels? Rigid panels mounted with an air gap run cooler, degrade slower, and usually carry longer warranties. Flexible panels save weight and suit curved roofs, but run hotter glued flat to the surface — which worsens the temperature derate — and tend to have shorter service lives.
Conclusion
The entire sizing decision reduces to four numbers, three of which only you can supply. First, your daily Wh — measured with a shunt monitor or a device-by-device audit of your actual gear, per season, never borrowed from a generic table. Second, your location’s peak sun hours — looked up from NREL data or PVWatts for the specific months and orientation you’ll actually use, with the worst planned month setting the target. Third, your system efficiency — an installation-specific product of controller efficiency, wiring drop, temperature derate, and shading, validated against measured harvest after install rather than assumed forever. Divide the first by the product of the second and third and you have the fourth number: required panel wattage, to which you add headroom for cloudy-day recovery and charge inefficiency.
Size for the worst-case month because solar failure is asymmetric: a summer surplus costs you nothing, while a winter deficit slowly murders a battery bank through chronic undercharge — and remember that the bank only offers the manufacturer-recommended depth of discharge, not its nameplate capacity. If the worst-month math demands more roof than you own, that is not a failure of the method; it is the method telling you early — while it’s still cheap — to cut winter consumption, add tilt or portable panels, or pair a right-sized array with a deliberate backup charging plan. Either way, the array you install will be built on your measurements, your sun, and your losses, which is the only kind that works.